

Insights on the global patent trends by the latest WIPO report

.avif)
- Innovators filed a record 3.46 million patent applications in 2022, up 1.7% on the previous year, after the global total rose from 1 million in 1995 to 2 million in 2010.
- Five offices take 84.9% of world filings: CNIPA, the USPTO, the JPO, KIPO, and the EPO. China alone received 1.6 million applications and lifted its global share from 27.7% in 2012 to 46.8% in 2022.
- Growth is uneven across the leaders. The EPO grew 2.6%, the USPTO managed 0.5% after 4.7% in 2021, Japan was flat, and South Korea fell 0.2% after four years of growth.
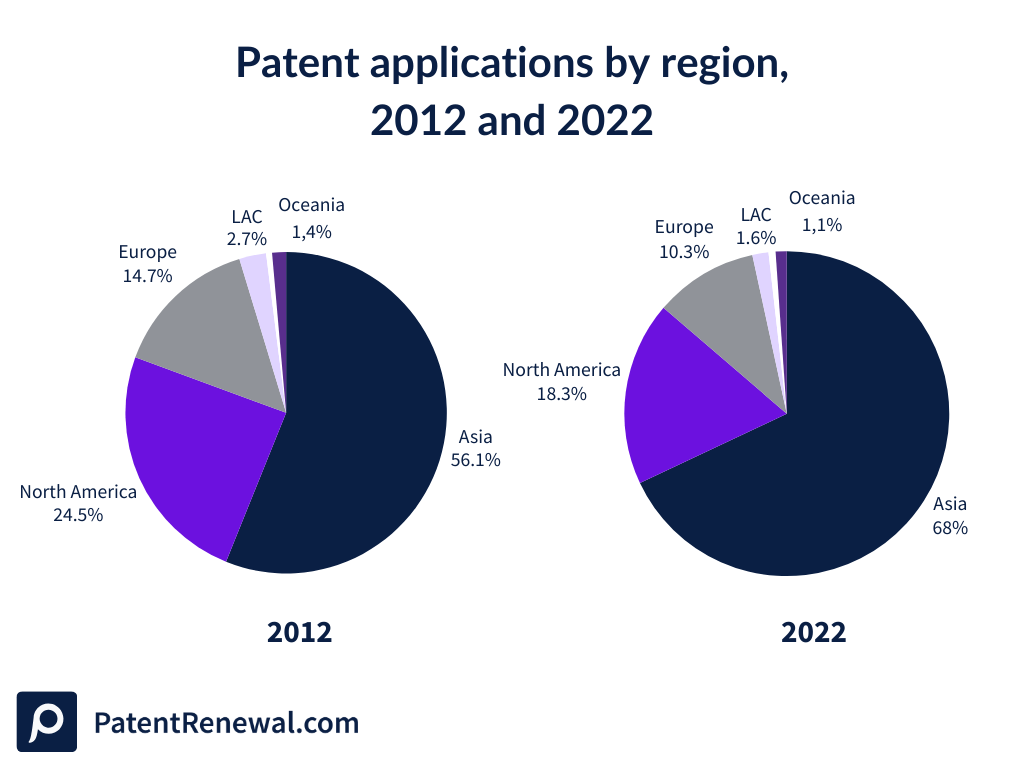
- Asia now receives 67.9% of all filings. North America's share dropped by 6.2% and Europe's by 4.4 percentage points from 2012 to 2022.
- Women made up 17.1% of listed inventors in 2022, up from 10.6% in 2008, and 34.7% of published applications named at least one woman inventor. The share is about 30% in biotechnology, food chemistry, and pharmaceuticals.
- Utility model filings grew 2.9% to 3 million, driven by China, which went from 740,290 in 2012 to 2.95 million in 2022 while Korea fell 75.2% and Japan 44.4%.
The trend in global patent applications has consistently been upward. The number of patent applications increased from 1 million in 1995 to 2 million in 2010 and 3.5 million in 2022.
According to the World Intellectual Property Organization (WIPO), innovators globally submitted a record 3.46 million patent applications, which marks a 1.7% increase compared to the previous year.
As the most recent annual World Intellectual Property Indicators report shows, there are many other telling statistics that have characterized the IP landscape in 2022. Let's delve deeper into these and the top patent offices' contributions to the application increase.
The top patent offices receiving the most patent filings
In the dynamic landscape of global patent filings, recent data reveals the leading patent offices and selected offices of low- and middle-income countries.
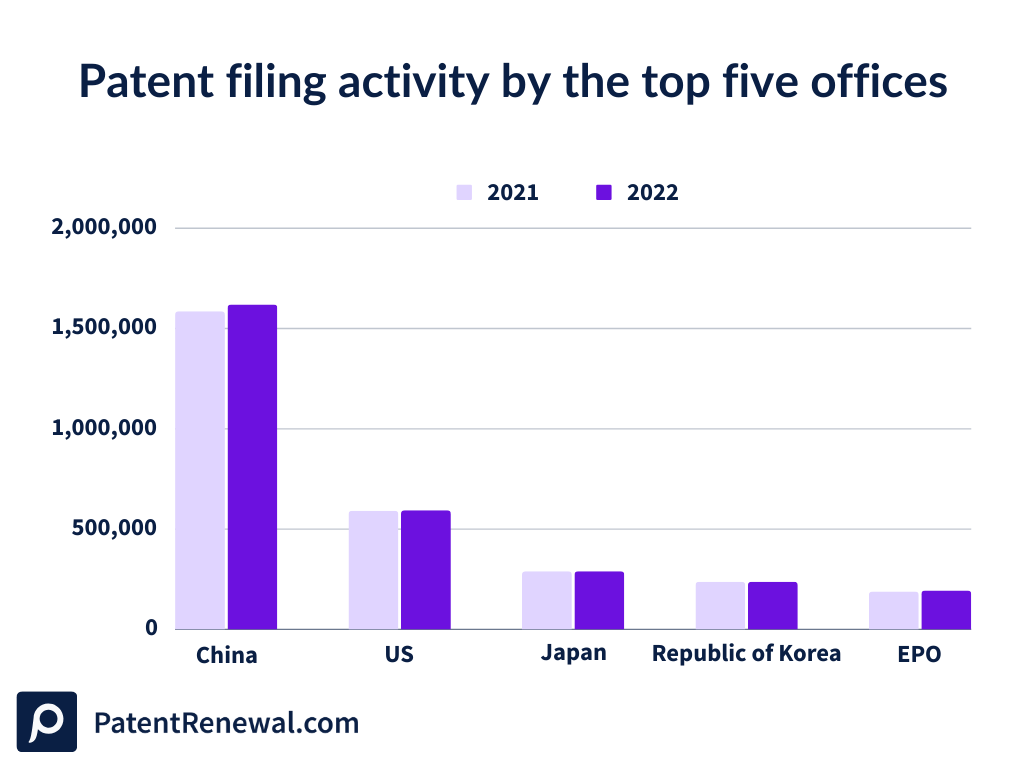
In 2022, the following top five patent offices represented 84.9% of the world's total share of patent filings. These offices are:
1. China: National Intellectual Property Administration (CNIPA)
2. United States: US Patent and Trademark Office (USPTO)
3. Japan: Japan Patent Office (JPO)
4. Republic of Korea: Korean Intellectual Property Office (KIPO)
5. EPO: European Patent Office (EPO)
China has seen a strong growth in patent filings for the third year in a row, making it to the top one office for patent filings. The EPO grew for the second year in a row, receiving 2.6% more applications than last year.
In 2022, the USPTO returned to modest growth with a 0.5% increase, compared to a 4.7% growth in 2021. Japan's 2022 filings stayed the same as last year, but South Korea's filings decreased by 0.2% after four years of growth.
China's dominant role in global patent applications
In a year filled with exciting global innovation, China's National Intellectual Property Administration (CNIPA) gained attention by receiving an impressive 1.6 million patent applications in 2022.
Their global market share increased from 27.7% in 2012 to an impressive 46.8% in 2022, demonstrating its significant growth. China continues its growth streak, marking a third successive year of increased filings, growing by 2.1% in 2022.
CNIPA has consistently received over a million applications annually since 2015, demonstrating a strong commitment to technological advancement.
Global patent applications by region
The distribution of global patent applications by region in 2022 reveals that patent offices located in Asia receive 67.9% of the world's total. This is not surprising, given that three of the top five patent offices with the highest patent applications are located in Asia: China, Japan, and Korea.
In contrast, Europe and North America witnessed a significant global patent application share decline during the same period. North America's share dropped by 6.2% from 2012 to 2022, while Europe's share fell by 4.4 percentage points. The combined share for Africa, Latin America, the Caribbean (LAC), and Oceania in 2022 stood at 3.5%, reflecting a 1.2 percentage point decrease from 2012.
This trend highlights Asia's role in the global patent landscape and how it continues to reshape the geography of innovation.
Gender dynamics in patent filings
There has been a positive development towards gender equality. According to the latest report from WIPO, the percentage of women listed as inventors in global patent applications has increased significantly from 10.6% in 2008 to 17.1% in 2022. In 2022, about 34.7% of published patent applications featured at least one woman inventor. This positive change is not limited to any particular region, an increase in the share of women inventors was noted in every continent of the world.
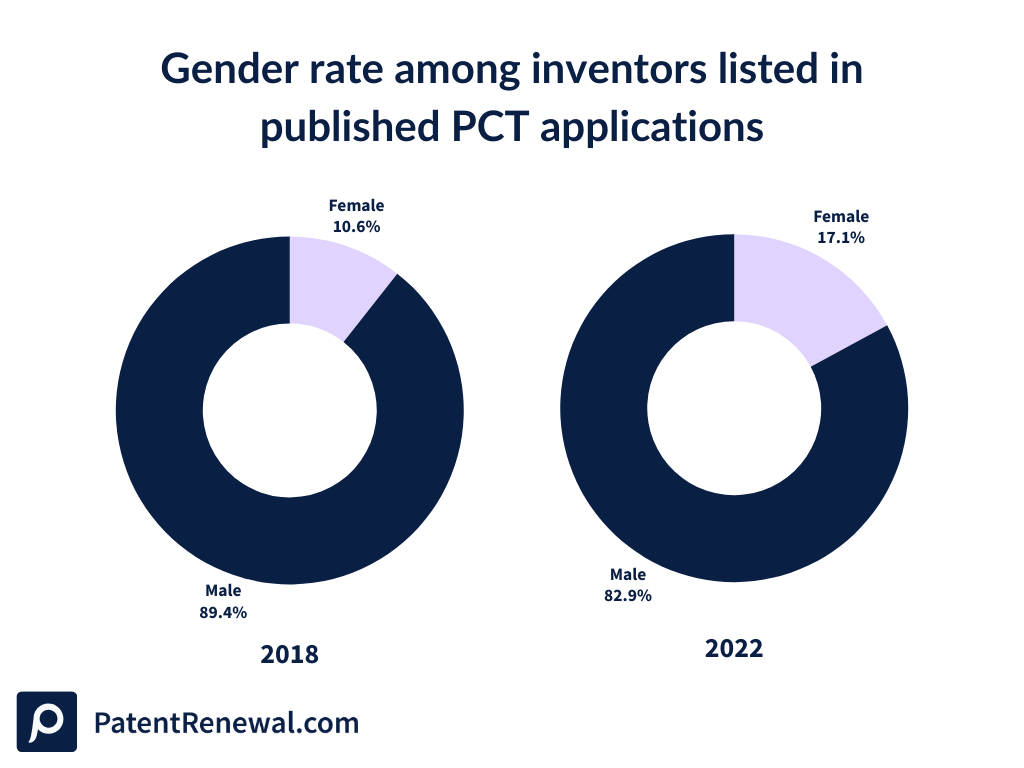
The gender gap still varies across countries, with China and Turkey leading in gender diversity, having nearly one-quarter of women inventors, while in Austria or Japan, only about 10% of inventors are women in 2022. The latest numbers show improvement but the significant gender gap is still notable when it comes to inventors credited on patent applications.
In fields like biotechnology, food chemistry, and pharmaceuticals, women made up about 30% of inventors in 2022. The positive trend indicates that we have more women making their mark in innovation, bringing diversity and creativity to the field, but there is still room for progress when it comes to the overall gender balance.
The rise in utility model applications
After a decline in 2021, utility model filing activity increased in 2022, recording growth of 2.9% and reaching a total of 3 million applications.
When examining the filing trend of the last decade, it is observed that Germany, Japan, the Republic of Korea, the Russian Federation, and Ukraine experienced a decrease in the number of utility model filings between 2012 and 2022.
The applications at the patent office of the Republic of Korea decreased by 75.2% while applications filed at the office of Japan declined by 44.4% over the same period. In contrast, China has seen an enormous growth in utility model patent filings – applications having increased from 740,290 in 2012 to 2.95 million by 2022.
In summary, 2022 saw significant changes in global patents. China emerged as a leader, more women entered the innovation arena, regional contributions shifted, and patent protection methods evolved.
If you are an IP owner yourself, check out our IP management software tool and save up to 50% on your IP renewals annually.


.png)
