FREE TOOL LAUNCHED! CALCULATE RENEWAL FEES FOR YOUR PATENT FAMILY INSTANTLY
Try now


The newest EPO Patent Index 2023 was released last week with with key patenting trends and fresh insights into the current intellectual property landscape.
The Patent Index report from the European Patent Office provides the main analysis of patent applications reflecting innovation across Europe and beyond. After the record-breaking patent applications in 2022, the recent index shows that this figure continued to even rise last year.
This blog post gives a detailed overview on the key statistics and analyses from the index, highlighting their significance for patentees and for the intellectual property community.
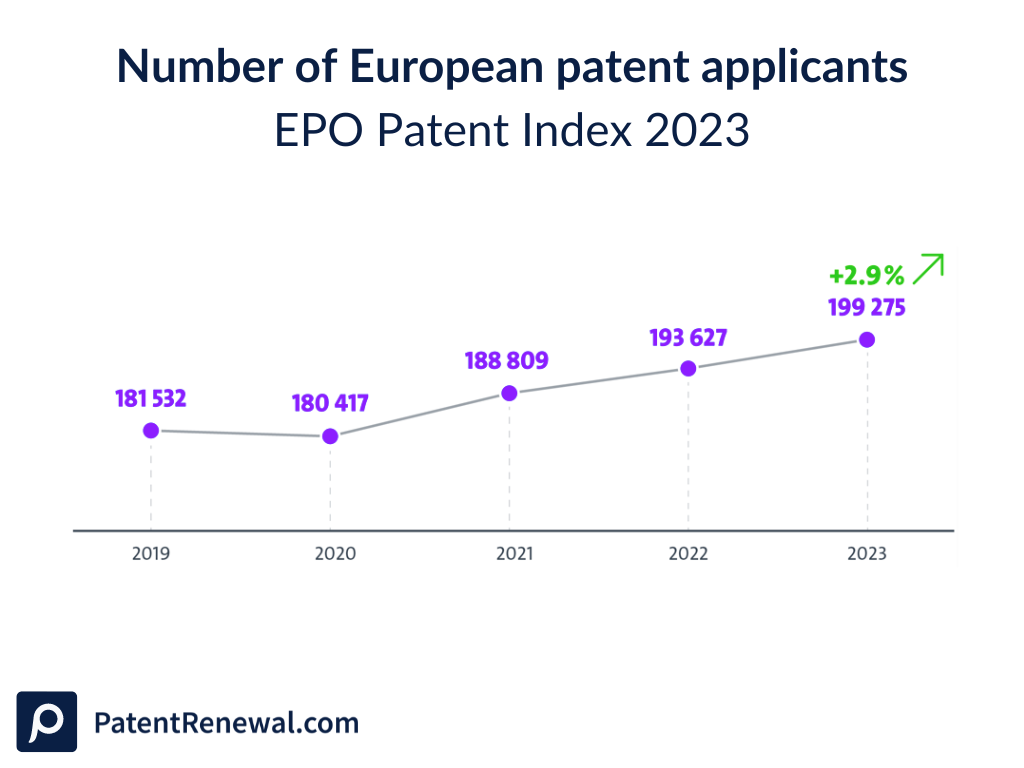
2023 witnessed a notable shift in the demand for European patents, with a significant increase in patent applications. The Patent Index shows that in 2023, 199 275 applications were filed for European patents, which is 2.9% higher than the previous year.
This increase is not just a number but an obvious sign of the growing recognition of the value that European patents bring to the intellectual property field.
The United States is in the first place when it comes to the share of applications to the EPO, with 24,2% of all applications in 2023. In Asia, Japan (10,8%), China (10,4%) and South Korea (6,3%) are responsible for the majority of European patent applications.
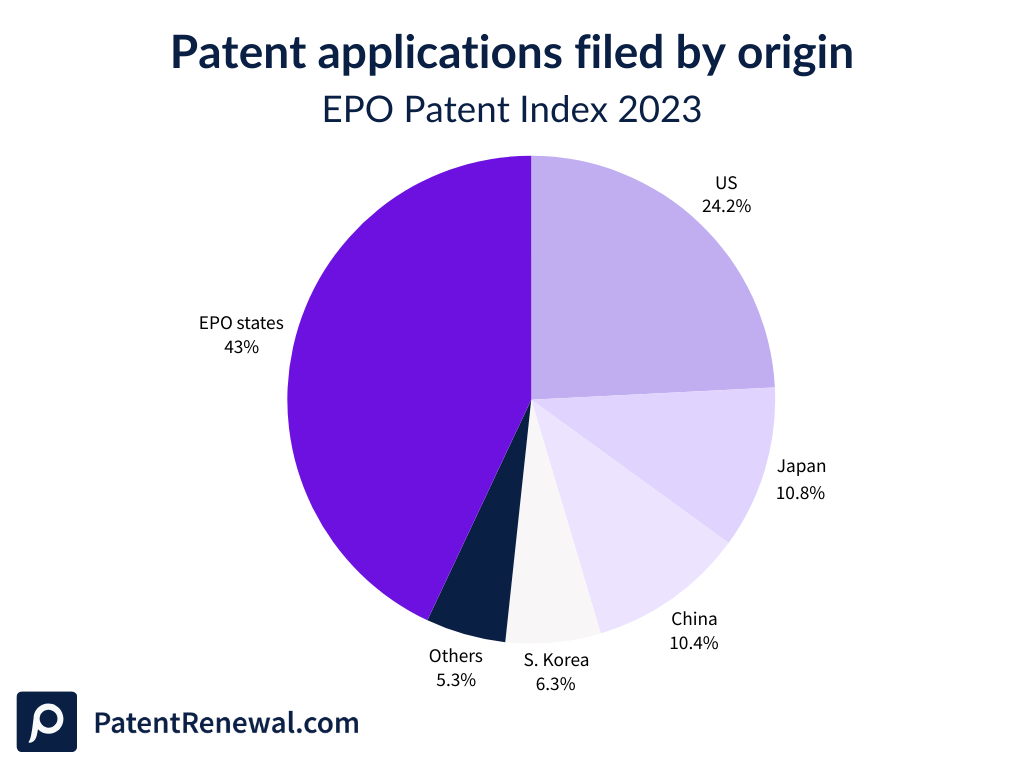
The landscape of patent applications within Europe is also showing a promising upward trend, as they filed significantly more patents than last year, accounting for 43% of the total EPO applications.
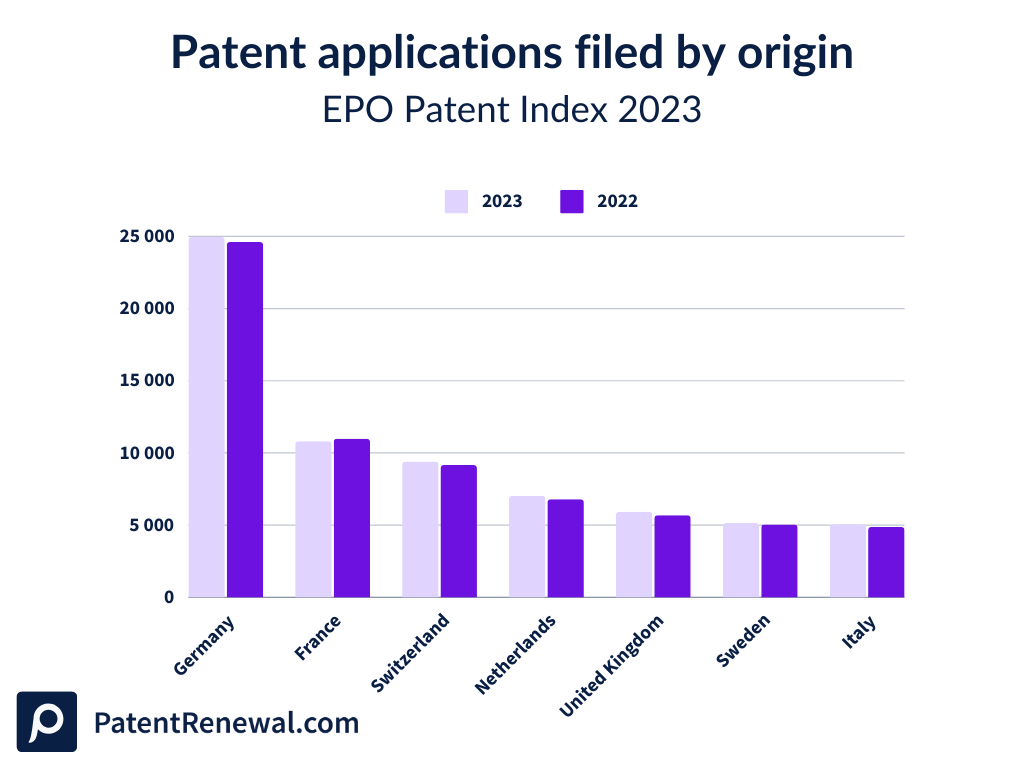
Germany continues to lead Europe in patent applications, with 24 966 filings, which is 12% of the total applications received by the EPO. France and Switzerland maintain their second and third-place rankings from last year’s index.
Of the top 7 countries with the most applications for European patents, all experienced an increase in the number of applications filed, except France.The most significant increase can be dedicated to the United Kingdom with 4,2% compared to last year.
In 2023, 57% of all European patent applications were accounted for by the combined number of filings in the top ten technology fields.
The index reveals dynamic technological progress and highlights the sectors that are leading the way in innovation. Eight of the top ten most patent-active technology fields showed growth in 2023.
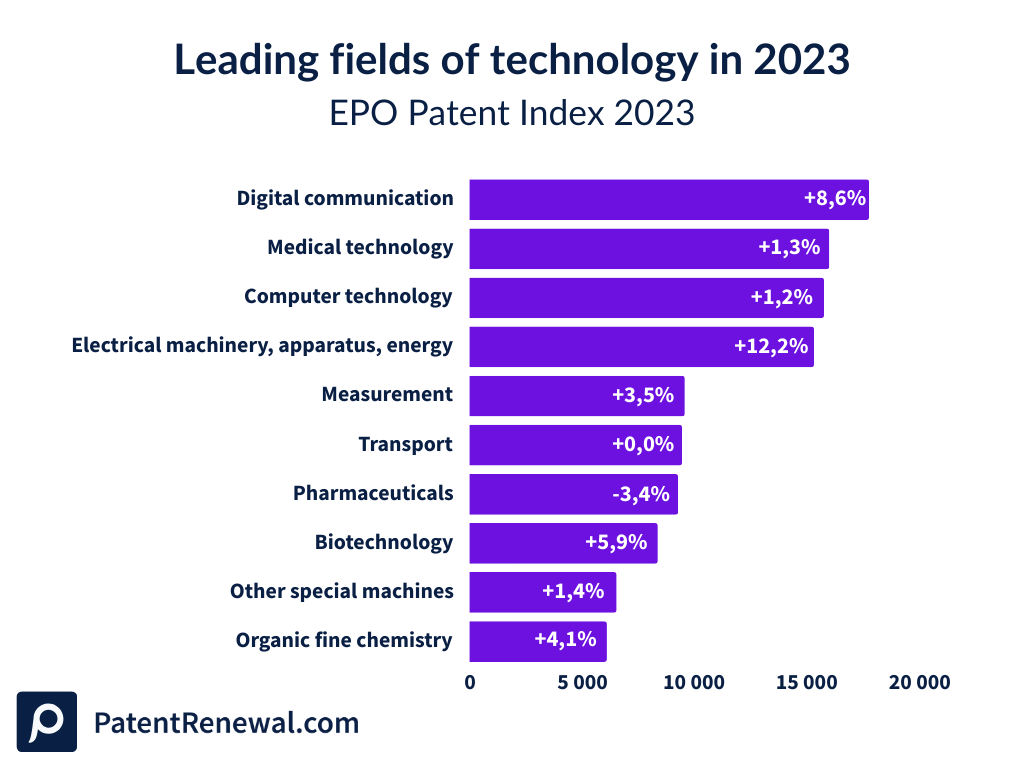
The field of electrical machinery, apparatus and energy, which includes clean energy inventions and battery technologies, grew the most with 12.2%.
Digital communication leads the sector with an impressive 17,749 applications - a clear sign of the sector's dynamic development, as indicated by an 8.6% increase compared to the previous year.
Medical technology and computer technology follow closely with 15,985 and 15,746 applications respectively. These strong figures show rapid growth but also indicate a continuous need for patent protection in the future.
A closer look at the top applicants in the 2023 index reveals the key players shaping the future of technology and innovation. These applicants are not just leading in terms of quantity but also exemplify the strategic role of patents in securing a competitive edge.
The top ten applicants contributed almost 13.2% of all filings to the EPO in 2023.
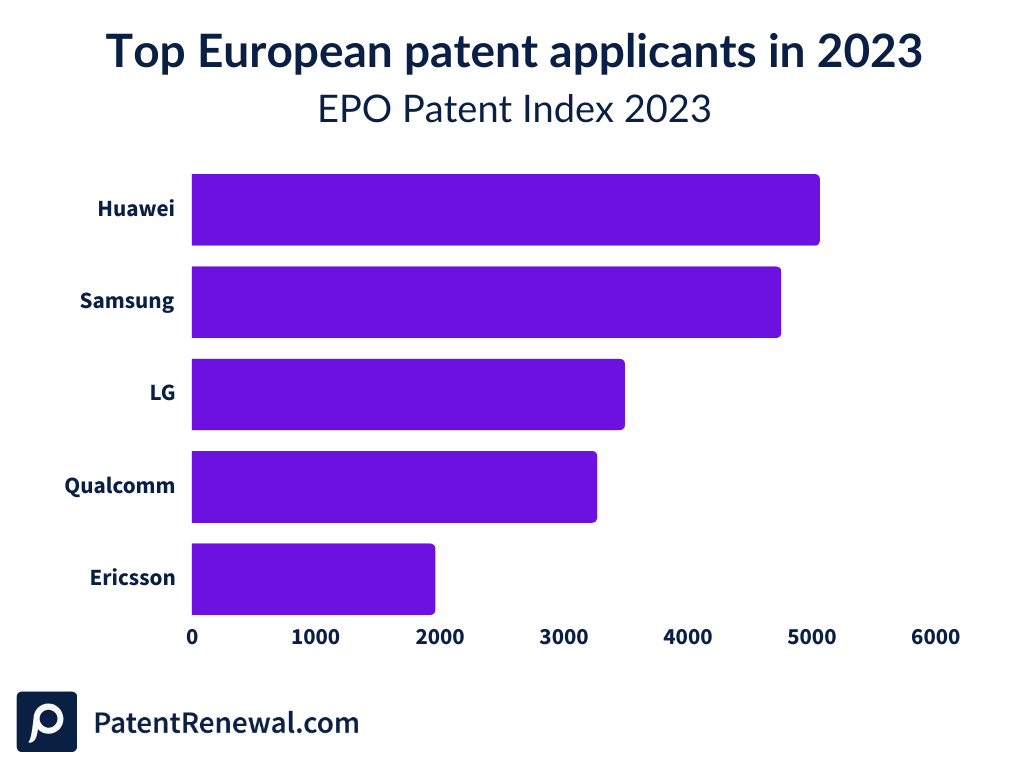
Although the EPO is based in Europe, surprisingly none of the top 5 applicants are European companies. Huawei was the top EPO patent applicant in 2023, accounting for 25% of filings from China, followed by Samsung and LG, which accounted for two-thirds of filings from South Korea.
Almost one in four patent applications from Europe were filed by individual inventors or small to medium-sized enterprises. Additionally, the share of filings from European universities and public research organizations also slightly increased to 8%.
In conclusion, the EPO Patent Index 2023 provides valuable insights for patent holders navigating the complexities of the IP landscape. By staying informed about these key statistics and trends, patentees can improve their patent management and maintenance efforts, ensuring their innovations stay well-protected in the future.
If you are an IP owner yourself, for more information on streamlined and cost-effective patent, design, and utility model renewals, book a demo with one of our experts or request a free price comparison.
Interested in a free IP renewal consultation? Benchmark your current IP renewal setup and costs against market standards.
.png)