

Innovation leaders: Countries with the most European patents
.avif)
.avif)
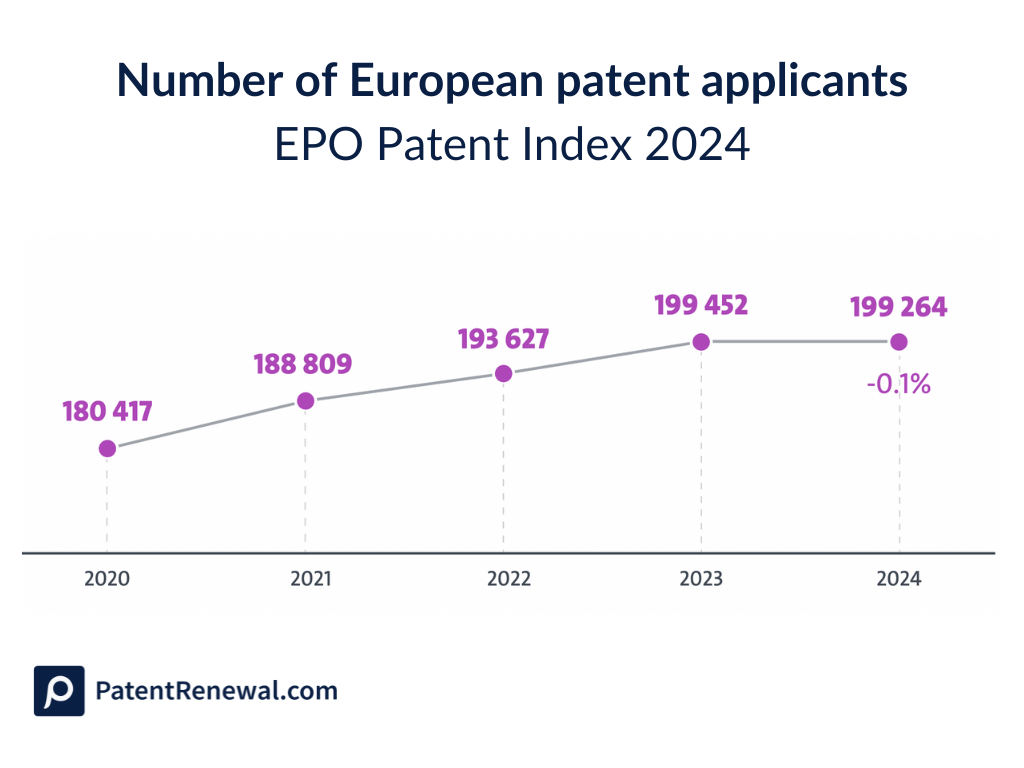
- The EPO received 199,264 patent applications in 2024, a decrease of 0.1% on 2023 that follows three consecutive years of growth.
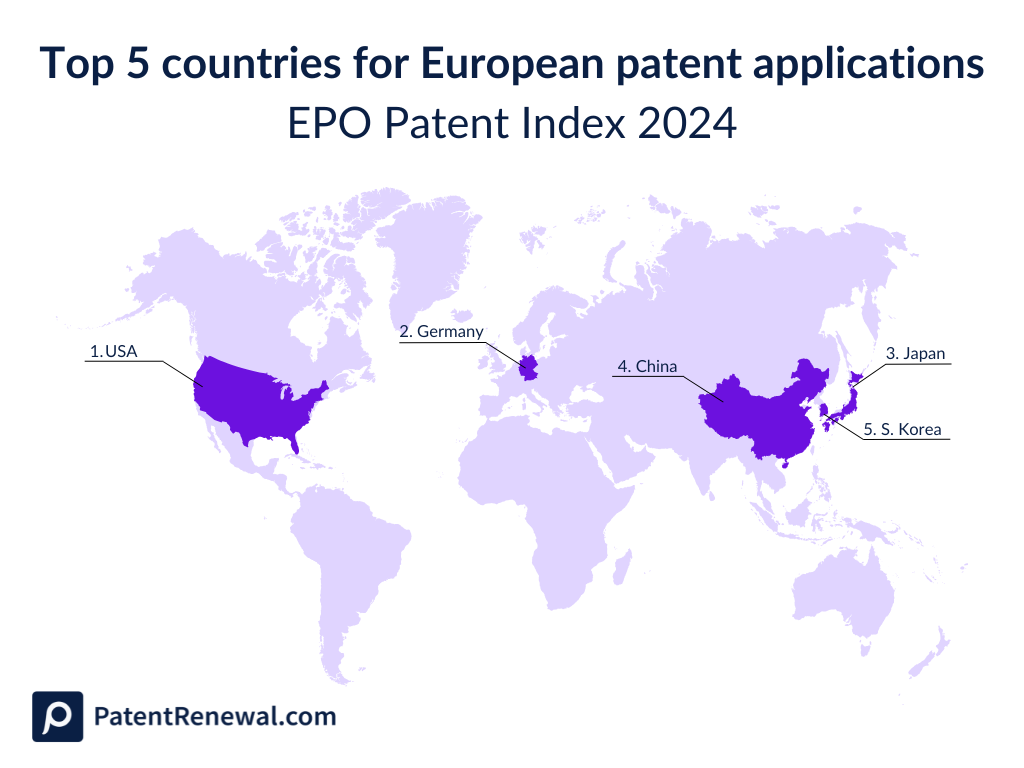
- The United States filed the most, followed by Germany, Japan, China, and the Republic of Korea.
- Korea grew fastest among the top filers at 4.2% while Japan slipped. Filings from the 39 EPO member states rose 0.3% and filings from outside Europe fell 0.4%.
- Switzerland grew 3.2% and remains Europe's top filer per capita, ahead of the UK at 3.1%, France at 1.1%, and Germany at 0.4%.
- Unitary Patents took 25.6% of all granted European patents, with over 28,000 requests, a 53% rise on 2023, and 57.5% uptake among European SMEs and universities.
- One in four European applications named at least one woman inventor, led by Spain at 42%, Belgium at 32%, and France at 31%.
Innovation in 2024 didn’t slow down, it got strategic. European patent filings tell a story that goes beyond numbers, it explains who’s playing the long game, who’s scaling fast, and who’s quietly moving up the ranks. From powerhouses like Germany and the U.S. to fast-climbers like South Korea and China, the competition to shape the future is heating up, and it’s all written in the filings.
Backed by data from the EPO’s 2024 Patent Index (released just now in 2025), this breakdown reveals the countries turning ideas into impact through European patents.
European patent filings hold steady in 2024
Before diving into the top-performing countries, it’s worth noting that the overall stability in European patent filings—despite economic headwinds—sends a clear message: innovation remains a global priority.
The number of European patent applications remained almost unchanged compared to 2023. Based on 199,264 patent applications filed with the EPO, this year's index reflects stability in global innovation activity. Although this is only a slight decrease of 0.1%, it follows three consecutive years of growth and shows that the pace of innovation remains strong.
- Applications from the 39 EPO member states rose by 0.3%.
- Applications from outside Europe dipped slightly by 0.4%.
This shows a growing reliance on the European patent system across a diverse set of countries and sectors.
Top 5 leading countries in European patent filings
5. Republic of Korea
South Korea exhibited the strongest growth among the top filers, with a 4.2% increase in European patent applications in 2024.
And it’s largely thanks to two familiar names: Samsung and LG. These companies have turned patenting into a competitive advantage, especially in electronics, displays, semiconductors, and communications.
Korea’s edge is speed. These firms move quickly to file — especially in fast-evolving sectors like AI, battery storage, and chip design — and they treat European patents as a key part of going global.
4. China
China has been moving up the ranks over the past decade, and 2024 was no different. Companies like Huawei and ZTE continue to lead filings in information and communication technologies — an area where China dominates globally.
What’s behind the growth? A mix of state-backed R&D programs, financial incentives for patenting, and a growing push to expand into overseas markets, including Europe. While many of China’s patents are still domestic, their European patent protection is catching up fast.
3. Japan
Japan's filings dropped slightly in 2024, Japanese companies remain focused on high-value areas like advanced manufacturing, robotics, and consumer electronics.
Sony, Panasonic, and Toyota are consistent filers — and Japan’s leadership in hydrogen tech shows how long-term research bets can turn into patent-heavy sectors.
2. Germany
As Europe's largest economy, Germany continues to be a powerhouse in patent filings. The country's emphasis on engineering excellence, particularly in the automotive and manufacturing industries, fuels its strong patent activity.
Companies like Siemens and Bosch keep filing across traditional mechanical fields, but there’s also growing movement in clean energy and battery tech.
Germany’s innovation strategy leans on strong in-house R&D, tight industry–university collaboration, and a culture of protecting inventions as early as possible.
1. U.S.
The US stayed on top again this year — and it’s not by accident. American companies like Qualcomm and RTX are major players in the European patent market, with a strong presence in computer technology, AI, and medical devices. What sets them apart is their early and aggressive approach to protecting R&D.
Big tech and biotech companies don’t wait until a product is close to launch. They file early and often, securing their position before the rest of the market even sees what’s coming.
The nation's emphasis on innovation in computer technology, particularly in artificial intelligence and machine learning, has been a significant driver. In 2024 alone, the U.S. invested $67.2 billion in private AI initiatives, substantially surpassing other countries.
Which EU countries filed the most patents in 2024?
European innovation stayed strong in 2024, with several countries showing solid growth in patent filings. Switzerland led the way with a 3.2% increase, maintaining its position as the top filer per capita across Europe. The UK followed closely with a 3.1% rise, while France and Germany saw smaller increases of 1.1% and 0.4%, respectively.
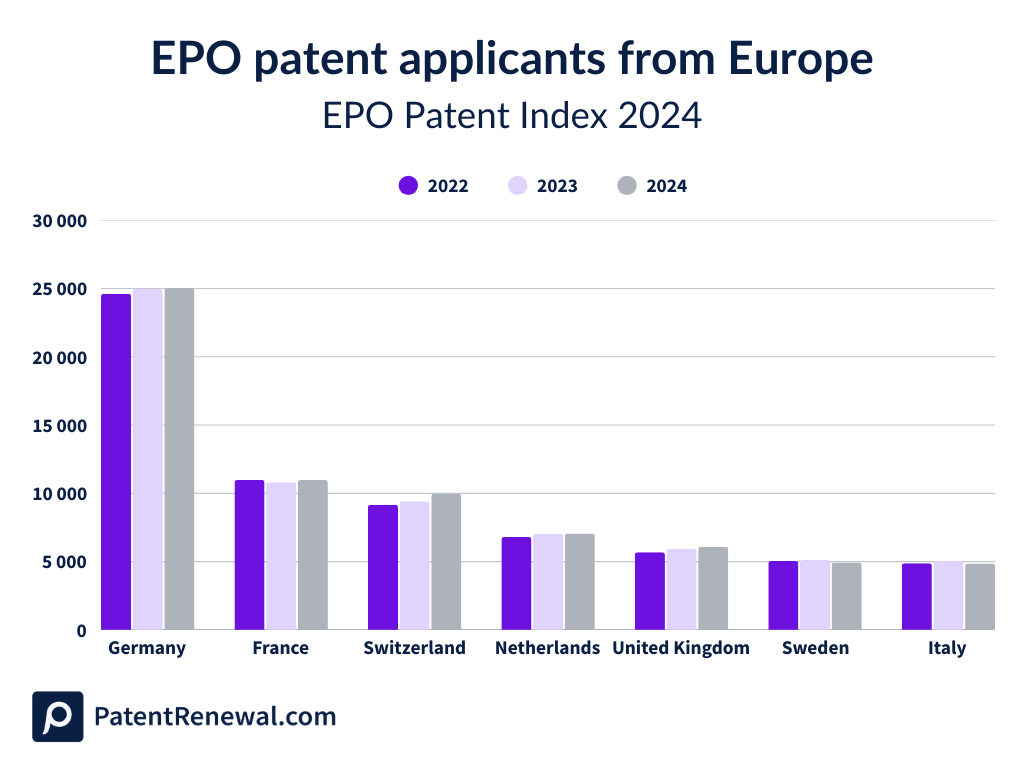
Although the overall filing volume from the EU27 declined slightly (-0.4%), individual countries still showed upward movement.
This speaks to a longstanding culture of innovation supported by strong public research institutions, generous R&D incentives, and forward-looking IP policies. Sweden has built global reputations in clean energy, biotech, and digital health—industries where European patents offer key protection for international growth.
These shifts suggest that innovation in Europe remains widely distributed, with both large economies and smaller, high-performing countries continuing to invest in patent protection.
Gender diversity in European patenting is rising
In 2024, one in four European patent applications named at least one woman as an inventor. Among countries with over 2,000 applications:
- Spain led with 42%
- Belgium followed with 32%
- France was close behind with 31%
This is a positive indicator of increased inclusivity in innovation among European patents, showcasing the shifting landscape of patent inventorship.
Unitary patent sees major uptake in second year
The Unitary Patent system—introduced in 2023—continues to exceed expectations. In 2024:
- 25.6% of all granted European patents were converted into Unitary Patents
- Over 28,000 Unitary Patent requests were made—a 53% increase from 2023
Uptake was strongest among:
- EPO member states (36.5% of their European patents converted)
- Republic of Korea (18.9%)
- China (17.9%)
- United States (16.0%)
- Japan (7.9%)
Smaller entities are especially inclined to use the system. In fact, European SMEs and universities had an impressive 57.5% uptake rate. For organizations focused on streamlining their IP management, this single-request model is a significant shift worth adopting.
What the European Patent Index report reveals
The top-filing countries are shaping the direction of global innovation. Whether it’s the U.S. leading with early-stage R&D filings, Germany driving engineering-heavy sectors, or South Korea racing ahead in semiconductors and AI, each nation’s activity tells a story about long-term priorities and market expansion strategies.
Regional growth, new market entries, and increased patent filings all point to a more competitive and fast-moving innovation landscape. Now is the time to look beyond your own portfolio and benchmark globally. Monitoring where filings are coming from—and which industries are accelerating—can help you anticipate shifts before they hit your sector.
Ready to simplify your IP management?
At PatentRenewal.com, we keep up with the fast-changing world of intellectual property and continually innovate our service by providing automated patent renewal processes and removing the manual burden of IP management.
Discover how our platform can revolutionize your patent maintenance process while securing your innovations. Check out our solution and experience the future of intellectual property management.
.png)