
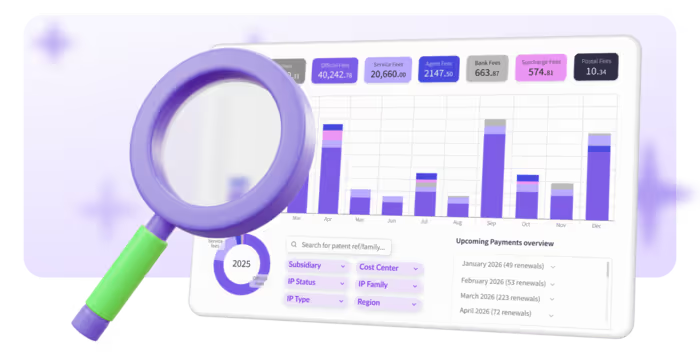

Patent portfolio management KPIs: What to measure
.avif)
.png)
- Business-fit KPIs (product coverage, market coverage, remaining term) show whether each patent family still protects something the company sells, in the markets where it sells it.
- Cost KPIs (cost per maintained family, additional-cost ratio, forecast accuracy) show what patent renewals really cost and whether finance can rely on the budget. In our verified dataset, the average official renewal fee is $517 per patent.
- Decision-quality KPIs (review coverage, pruning timing, pruning rate) show whether renewals are actively decided or simply paid. Around 98% of patents in our data remain active through Year 6, and LexisNexis IP measured an average pruning rate of about 20% over five years across 133 large patent holders.
- Process-health KPIs (late payment rate, unintended lapses, docket data accuracy) show whether deadlines and payments are handled reliably. The average late payment rate in our dataset is 4.8%, and a rate below 2% is a useful internal target.
- Value KPIs (licensing revenue, enforcement success rate) connect the portfolio to income and to results when patents are challenged.
The most useful patent portfolio management KPIs look beyond filing activity and measure the patents you already pay to maintain. They show whether your portfolio still supports the business, what patent renewals cost, how consistently your team reviews keep-or-drop decisions, whether renewal fees are paid on time, and what value the portfolio returns.
Ask an IP team how many applications it filed last year and you will usually get an answer in seconds. Ask what each patent family costs to renew and maintain, or how many patent renewals were paid without anyone recording an active keep decision, and the answer often takes much longer.
That gap matters because a large share of lifetime patent spending comes after filing. LexisNexis IP estimates that nearly $10 billion in patent renewal fees falls due in 2026 alone.
This guide covers the KPIs that help close that gap. For each one, you will find what it measures, how to calculate it, a benchmark where a credible one exists, and how to present it to finance.
What are patent portfolio management KPIs?
Patent portfolio management KPIs are the small set of numbers an IP team tracks to understand whether its portfolio protects the business at a sensible cost.
Good KPIs connect each patent family, meaning one invention protected across several countries, to a product, market, or revenue line. They also track the patent renewal decisions that keep the portfolio aligned with current business priorities.
It helps to separate KPIs from the activity-based IP metrics that many dashboards start with.
An activity metric counts work, such as invention disclosures received or office actions answered. A KPI tells a decision-maker whether the portfolio is getting better or worse at doing its job.
Both belong on an IP dashboard, but KPIs provide the context needed to justify a budget, explain a change in spending, or identify where the portfolio needs attention.
Filing metrics tell only the first part of the story
When the Intellectual Property Owners Association interviewed corporate IP departments about their metrics, nearly all of them tracked applications filed, patents granted, and pending cases.
Many companies also tried to measure portfolio strength, such as whether patent claims cover current or future products, but each company approached that measurement differently.
The interviews also showed where filing metrics can fall short.
One global chemicals company had set annual filing targets but dropped them after the targets encouraged a high volume of low-value applications. A Fortune 100 industrial company tracks its success rate in oppositions instead of simply counting how many it files, because the count alone says little about portfolio strength.
In the same IPO study, a Fortune 500 chemical company also found that its business leaders did not know how to interpret ratios such as patent budget compared with R&D spend. Instead of chasing a single “good” number, the IP team focused on trends.
Filing metrics still belong on your dashboard because they describe the pipeline. But once patents enter the maintained portfolio, patent renewal costs, portfolio reviews, and keep-or-drop decisions start shaping the long-term budget.
That is where the five KPI groups below become useful.
The five KPI groups at a glance
The KPIs in this guide fall into five groups. Each group answers one question that finance or leadership will eventually ask about a maintained portfolio:
- Business fit: Does the portfolio still match the products and markets the company has today?
- Cost: What does maintaining it really cost, and can finance rely on the forecast?
- Decision quality: Are renewals actively reviewed, or paid by default?
- Process health: Are deadlines, approvals, and payments handled reliably?
- Value: What income and enforcement results does the portfolio produce?
A portfolio with healthy cost numbers but low review coverage, for example, is cheap to run but not actively managed.
The table below summarizes every KPI in the guide. The sections that follow explain how to measure each one and what the result can tell you.
You do not need to track all thirteen. The sections below explain each KPI in turn, with an example of how to measure it. The section on reporting to finance then shows how to choose the five to seven that best suit your portfolio and your audience.
Business-fit KPIs show whether the portfolio still matches what the company sells
Business-fit KPIs answer the question every CFO eventually asks: What does this patent actually protect?
Business-fit KPI 1: Product coverage
Product coverage is the core measure. To calculate it, tag each maintained patent family with the product, product line, or roadmap item it covers. Then divide the number of tagged families by the total number of maintained families.
There is no reliable public benchmark for product coverage, so your own trend matters more than an external target.
A falling share can indicate that the business has moved on while parts of the patent portfolio have not. Families without a current product or roadmap tag become a natural review list.
Our guide on deciding which patents to renew explains the questions to ask when reviewing each one.
Business-fit KPI 2: Market coverage
Market coverage applies the same logic to geography. Many portfolios still include countries selected at filing, years before anyone knew where the product would sell or where competitors would appear.
Comparing the countries you maintain with your current revenue markets, manufacturing locations and competitor activity often shows renewals in markets that no longer matter. A full patent portfolio audit combines the product and geographic views.
Business-fit KPI 3: Remaining-term profile
A remaining-term profile groups maintained families by years of protection left, which shows when coverage ends and when renewal fees will peak.
Group patent families by their remaining years of protection to see when coverage for important products will end and when patent renewal fees are likely to peak.
That information feeds directly into your renewal cost forecasting.
Cost KPIs show what your patent renewals really cost
Cost KPI 1: Cost per maintained family
Cost per maintained family turns a large annual patent renewal budget into a number that teams can compare over time.
Calculate it by dividing your total annual patent renewal spend by the number of maintained patent families.
As a hypothetical example, a portfolio of 400 families spending $1.2 million a year on renewals pays an average of $8,000 per maintained family per year. This metric becomes especially useful when you track it over several years or compare different business units.
Cost KPI 2: Additional-cost ratio
The additional-cost ratio is what you pay on top of official fees (service fees, agent fees and FX markups) divided by the official fees.
Patent offices set the official fees. In our 2025 Patent Lifecycle Report, the average official patent renewal fee across our verified dataset was $517 per patent.
On top of the official patent office fee, companies may also pay:
- service fees
- local agent fees
- currency conversion costs or FX markups
Calculate the additional-cost ratio by dividing those costs by the official patent office fees.
This shows how much you pay on top of the official cost of patent renewals and makes it easier to compare different renewal providers or processes.
Our guide to how patent renewal costs are built explains each cost layer. You can also use our article to the most common patent renewal invoice mistakes to identify charges that deserve a closer look.
Cost KPI 3: Forecast accuracy
Forecast accuracy matters most to finance. If the IP renewal budget repeatedly differs from actual spending, finance has less reason to rely on the forecast.
Compare actual patent renewal spend with the budget each quarter and explain the largest differences. That gives finance a clearer picture of upcoming costs and helps the IP team understand what drives unexpected changes.
Our guide to building a predictive patent renewal cost forecast covers the inputs that make renewal forecasts more reliable.
Cost KPI 4: Patent spend as a share of R&D spend
IP spend as a share of R&D spend is another common cost metric, but it works best as a trend rather than as a fixed benchmark.
The ratio becomes difficult to act on when nobody can define what a universally "good" value should be. Track how the ratio changes over time instead.
Decision-quality KPIs show how your team makes patent renewal decisions
Decision-quality KPIs measure how patents stay in or leave the portfolio. For many IP teams, this is one of the areas where portfolio data provides the least visibility.
Decision-quality KPI 1: Review coverage
Review coverage is the starting point. Calculate the percentage of patent renewals due during a period that had a recorded keep or drop decision before payment.
If the team pays a renewal without recording an active keep decision, count it as uncovered, even if keeping the patent ultimately made sense. This KPI separates deliberate patent renewal decisions from automatic continuation.
Decision-quality KPI 2: Patent renewal timing
Around 98% of patents are still active through Year 6, and renewal activity peaks in Year 7, when fees step up sharply in several major jurisdictions. The figure comes from the 2025 Patent Lifecycle Report, which covers tens of thousands of renewals across more than 230 jurisdictions from 2018 to 2025.
Between Years 6 and 7, patent renewal fees rise by:
The average patent lapse occurs at 10.7 years.
Decision-quality KPI 3: Pruning timing
Pruning timing shows how early a company makes decisions to let patents lapse. For example, you can track what percentage of discontinued patent families were dropped before Year 7, rather than in later, more expensive renewal years.
That does not automatically mean the earlier patent renewal payments were unnecessary. Patent value can change over time. However, the KPI helps teams identify whether they review the portfolio early enough to make deliberate decisions before major fee increases.
If you also track the reason behind each drop, your abandoned patent records become a useful record of portfolio decisions instead of simply a list of lost assets.
Decision-quality KPI 4: Pruning rate
Pruning rate shows how much of a patent portfolio a company decides to discontinue over a given period. For example, if a company starts with 1,000 active patent families and drops 200 over five years, its five-year pruning rate is 20%.
Pruning rate has one of the strongest external benchmarks among the KPIs in this guide.
LexisNexis IP followed about one million active patent families held by 133 large innovators from 2020 to 2025 and found that roughly 20% had been pruned by the end of the period.
Rates varied substantially by industry:
- around 13% in aerospace and defense, chemicals, and semiconductors
- around 22% to 28% in industrial automation, imaging, and automotive
The research also found geographic differences. Japanese companies pruned nearly 30%, while European and US companies pruned around 18% to 19%.
The same research found that patents in the highest quality groups lasted up to 30% longer than patents in the lowest quality groups. This suggests that the companies in the study tended to retain stronger assets for longer.
US patent maintenance fee data points in a similar direction.
Patently-O found that around 40% of US patentees now pay all three patent maintenance fees, down from a peak of roughly 52% around 2012 and 2013.
A portfolio that retains a much higher share is not necessarily poorly managed. But the IP team should understand what drives that retention.
Decision-quality KPI 5: Defensive patents criteria
Defensive patents need slightly different criteria. They may not link directly to a product, which can make them appear weak in a business-fit review even when they play an important strategic role.
Score these patents separately so that your pruning KPI does not penalize patents whose purpose is to deter competitors, preserve freedom to operate, or strengthen a broader portfolio position rather than cover a specific product.
Patent renewal process KPIs: how often are renewal fees paid late?
Process-health KPIs show whether your patent renewal management process handles deadlines, approvals, and payments reliably.
The late payment rate provides one of the clearest signals. In our Patent Lifecycle Report data: 95.2% of patent renewals were paid on time. The remaining: 4.8% incurred surcharges averaging $225 per late renewal.
As a practical internal target, a late payment rate below 2% can indicate strong renewal controls when compared with the 4.8% average in our dataset.
Process-health KPI 1: Late payment rate
Most late renewal payments come from process gaps rather than forgetfulness: slow approvals, unclear ownership between legal and finance, and instructions that reach the local agent too late.
Common causes include:
- slow internal approvals
- unclear ownership between legal and finance
- delayed instructions
- handoff problems between teams
- instructions reaching a local agent too close to the deadline
To calculate your late payment rate, divide the number of patent renewals paid after their original deadlines by the total number of renewals due in the same period, then multiply by 100. For example, if 25 out of 1,000 renewals were paid late, your late payment rate would be 2.5%.
The rate also varies widely by jurisdiction. In our data, late payment rates ranged from 0.86% in Indonesia to 20.83% in Vietnam.
Tracking late payments by jurisdiction can therefore help you identify where your patent renewal process needs additional attention.
Our patent grace period and surcharge checker shows what each patent office allows once a renewal deadline has passed.
Process-health KPI 2: Unintended lapses
Unintended lapses are the most serious version of the same process problem. Count every patent that your organization loses or needs to reinstate because of a process error, and record the associated reinstatement cost.
Even one unintended lapse involving an important patent family can create a much larger problem than a year of late-payment surcharges.
Process-health KPI 3: Docket data accuracy
Docket data accuracy sits underneath all of these metrics. If your internal records do not match the relevant patent office registers, every KPI that relies on those records can inherit the same error.
A quarterly spot check of a sample of portfolio records against official patent office data can help identify discrepancies before they affect patent renewal deadlines or instructions.
Value KPIs connect patents to revenue and enforcement
Value KPIs measure what the patent portfolio returns to the business. They are also among the hardest metrics to measure consistently.
Value KPI 1: Licensing revenue
Licensing revenue provides the most direct financial measure. Report both:
- total licensing and royalty income
- licensing revenue per licensed patent family
This helps you see whether income comes from a broad licensing program or from a small number of particularly valuable assets.
Our guide to patent licensing explains how those agreements usually work.
Value KPI 2: Enforcement success rate
Enforcement success rate is the share of concluded oppositions and disputes that end in your favor, not the number you start.
Value KPI 3: Indirect value
Indirect value is what a patent returns without licensing income: exclusivity, product protection and leverage in negotiations.
A patent can create value through exclusivity, product protection, competitive positioning, or strategic leverage.
The business-fit KPIs already capture part of this picture by connecting patent families to the products and markets they protect. For a broader framework, see our guide to measuring ROI on an IP portfolio.
How to report patent portfolio KPIs to finance
The most useful patent dashboard for finance is short, consistent, and connected to upcoming decisions. Start with five to seven KPIs.
Focus on the ones that help finance understand what the patent portfolio protects, how much it costs to maintain, how predictable future spending is, and whether renewal decisions are being made on time. A strong starting set for many corporate patent portfolios includes:
- product coverage
- cost per maintained family
- forecast accuracy
- review coverage
- pruning rate
- late payment rate
Report each KPI as a trend. Finance teams already compare results with the previous quarter or year, and a trend often provides more useful context than a target with no reliable external benchmark.
Keep the KPI definitions consistent from one reporting period to the next so that the comparison remains meaningful.
Connect KPIs to the patent renewal calendar
The report is most useful when it sits next to the renewal calendar. Connect the dashboard to the patent renewal calendar.
For example, list the patent families approaching a major fee increase, such as the Year 7 step-up, alongside:
- the product or business area they protect
- their annual patent renewal cost
- their remaining term
- their latest keep-or-drop decision
This turns the KPI report into a practical review list that legal, IP, and finance teams can use before patent renewal fees fall due.
Benchmark your portfolio against real patent renewal data
Benchmarking means comparing your KPI results with industry standards or similar portfolios, rather than only looking at your own past performance.
For patent renewal costs, this means comparing what you pay per patent in each jurisdiction with current market rates. To make the comparison fair, you need to separate official patent office fees from additional charges, such as service fees, local agent fees, currency markups, and transaction fees.
Our free IP renewal cost audit helps you do exactly that. Simply upload your IP portfolio data or a recent renewal invoice to see how your costs compare with market rates across the jurisdictions where you renew.
You'll get a breakdown of official and non-official fees, an overview of your upcoming patent annuity costs, and, if you upload an invoice, a clear view of any charges that exceed market rates.
Frequently asked questions
Who should own patent portfolio KPIs?
The IP team should own the definitions and reporting because it manages the portfolio and docket data. Finance should co-own the cost KPIs because it sets and monitors the budget against which the team measures patent renewal spending.
Business units should confirm which products each patent family protects at least once a year. This keeps product coverage data aligned with the current business.
How often should a patent portfolio be reviewed?
Review the full patent portfolio at least once a year to set overall direction. Then review individual families before major patent renewal deadlines, particularly ahead of significant renewal fee increases such as the Year 7 step-up.
Deadline-based reviews matter most for cost control because they give the business an opportunity to make a deliberate keep-or-drop decision before the next payment. Recording each decision also provides the data needed for your review coverage KPI.
Which KPIs matter most for a small patent portfolio?
With fewer than about 50 families, three KPIs can often provide enough visibility:
- cost per maintained family
- review coverage
- late payment rate
Pruning benchmarks from large patent holders do not translate as easily to small portfolios because a single dropped patent family can change the percentage substantially. For smaller portfolios, focus on reviewing each family individually and tracking the cost and reasoning behind each patent renewal decision.
Do these KPIs work for law firms managing client portfolios?
Most of them do, but the emphasis changes. A law firm usually controls the renewal process rather than the client's portfolio strategy. The most relevant KPIs therefore include:
- late payment rate
- docket accuracy
- time between sending a patent renewal reminder and receiving the client's instruction
Sharing cost-per-family data with clients can also give them better information for keep-or-drop decisions.
What data do you need to start tracking patent KPIs?
You need:
- a docket export with patent family IDs, countries, and next due dates
- patent renewal invoices that separate official fees from service fees
- a product, business unit, or business owner tagged to each patent family
Most teams already have the first two. Product and business tags often take one portfolio review cycle to build, but once they exist, they make both business-fit KPIs and patent renewal decisions much easier to track.
.png)
