FREE TOOL LAUNCHED! CALCULATE RENEWAL FEES FOR YOUR PATENT FAMILY INSTANTLY
Try now

.png)
We’ve recently published our 2025 Patent Lifecycle Report, based on our own research, proprietary data, and expert analysis of tens of thousands of renewals across more than 230 jurisdictions from 2018 to 2025.
The report looks at how patents evolve over time, when renewal decisions tend to change, how costs build up across different countries, and where operational risks and hidden fees usually appear. It also includes detailed benchmarks, country-level comparisons, and practical recommendations for patent portfolio management.
In this summary article, we highlight some of the key findings from the report. We focus on what portfolios really cost to maintain, why some budgets stay stable while others spike, and which patterns most often lead to avoidable spending.
If you’d like to explore the full report, deeper analysis, and complete benchmarks, you can download the full 2025 Patent Lifecycle Report here.
Each patent is filed with an intended purpose, but its relevance must be tested over time. Commercial value, enforcement potential, and strategic fit do not remain static. We follow patents from early years where patent renewals happen almost by default through later stages where value, cost, and strategy are significant.
Although most patents can last up to 20 years typically, renewal behavior follows a remarkably consistent pattern. In the first six years, most portfolios operate on autopilot. Our data shows that around 98% of patents remain active through Year 6. Renewal costs are still relatively low, and active pruning is rare. At this stage, teams tend to renew by default, even when commercial relevance is uncertain.
This matters because cost pressure increases sharply after this phase. Between Years 6 and 7, renewal fees rise by 66.7% in China, 141% in Japan, and 87.9% in the United States between the first and second maintenance payments. Portfolios that reach this point without prior evaluation enter a high-cost phase with weak strategic filtering.

Year 7 represents the first major commitment checkpoint. Patent renewal activity peaks in this year, making it the highest-volume renewal period across portfolios. At the same time, products, markets, and competitive positions are usually clearer. From a data perspective, this is where patent renewal should shift from routine protection to active commercial validation.
After Year 7, portfolios enter what we describe as the pruning phase. In our dataset the average patent lapse happens at 10.7 years, far earlier than its legal maximum. Between Years 8 and 11, lapse rates rise as companies begin to actively reduce non-core assets. This coincides with major fee increases. By Year 11, 28.13 % of jurisdictions show renewal fee jumps of more than 25 % year over year.
Patents that remain active beyond Year 12 form the strategic core of the portfolio. Patents that are still active after Year 12 usually represent the core of a portfolio. They are expensive to maintain and kept for a clear business reason. At this stage, the biggest risk is no longer strategic, but operational. A missed deadline or incorrect payment can undo years of investment in a single moment.
The key insight is that portfolio behavior follows a pattern. Whether that pattern produces value or waste depends on how consciously it is managed.
Official fees are often treated as fixed inputs. In reality, jurisdictional exposure shapes long-term budgets more than most organizations anticipate.
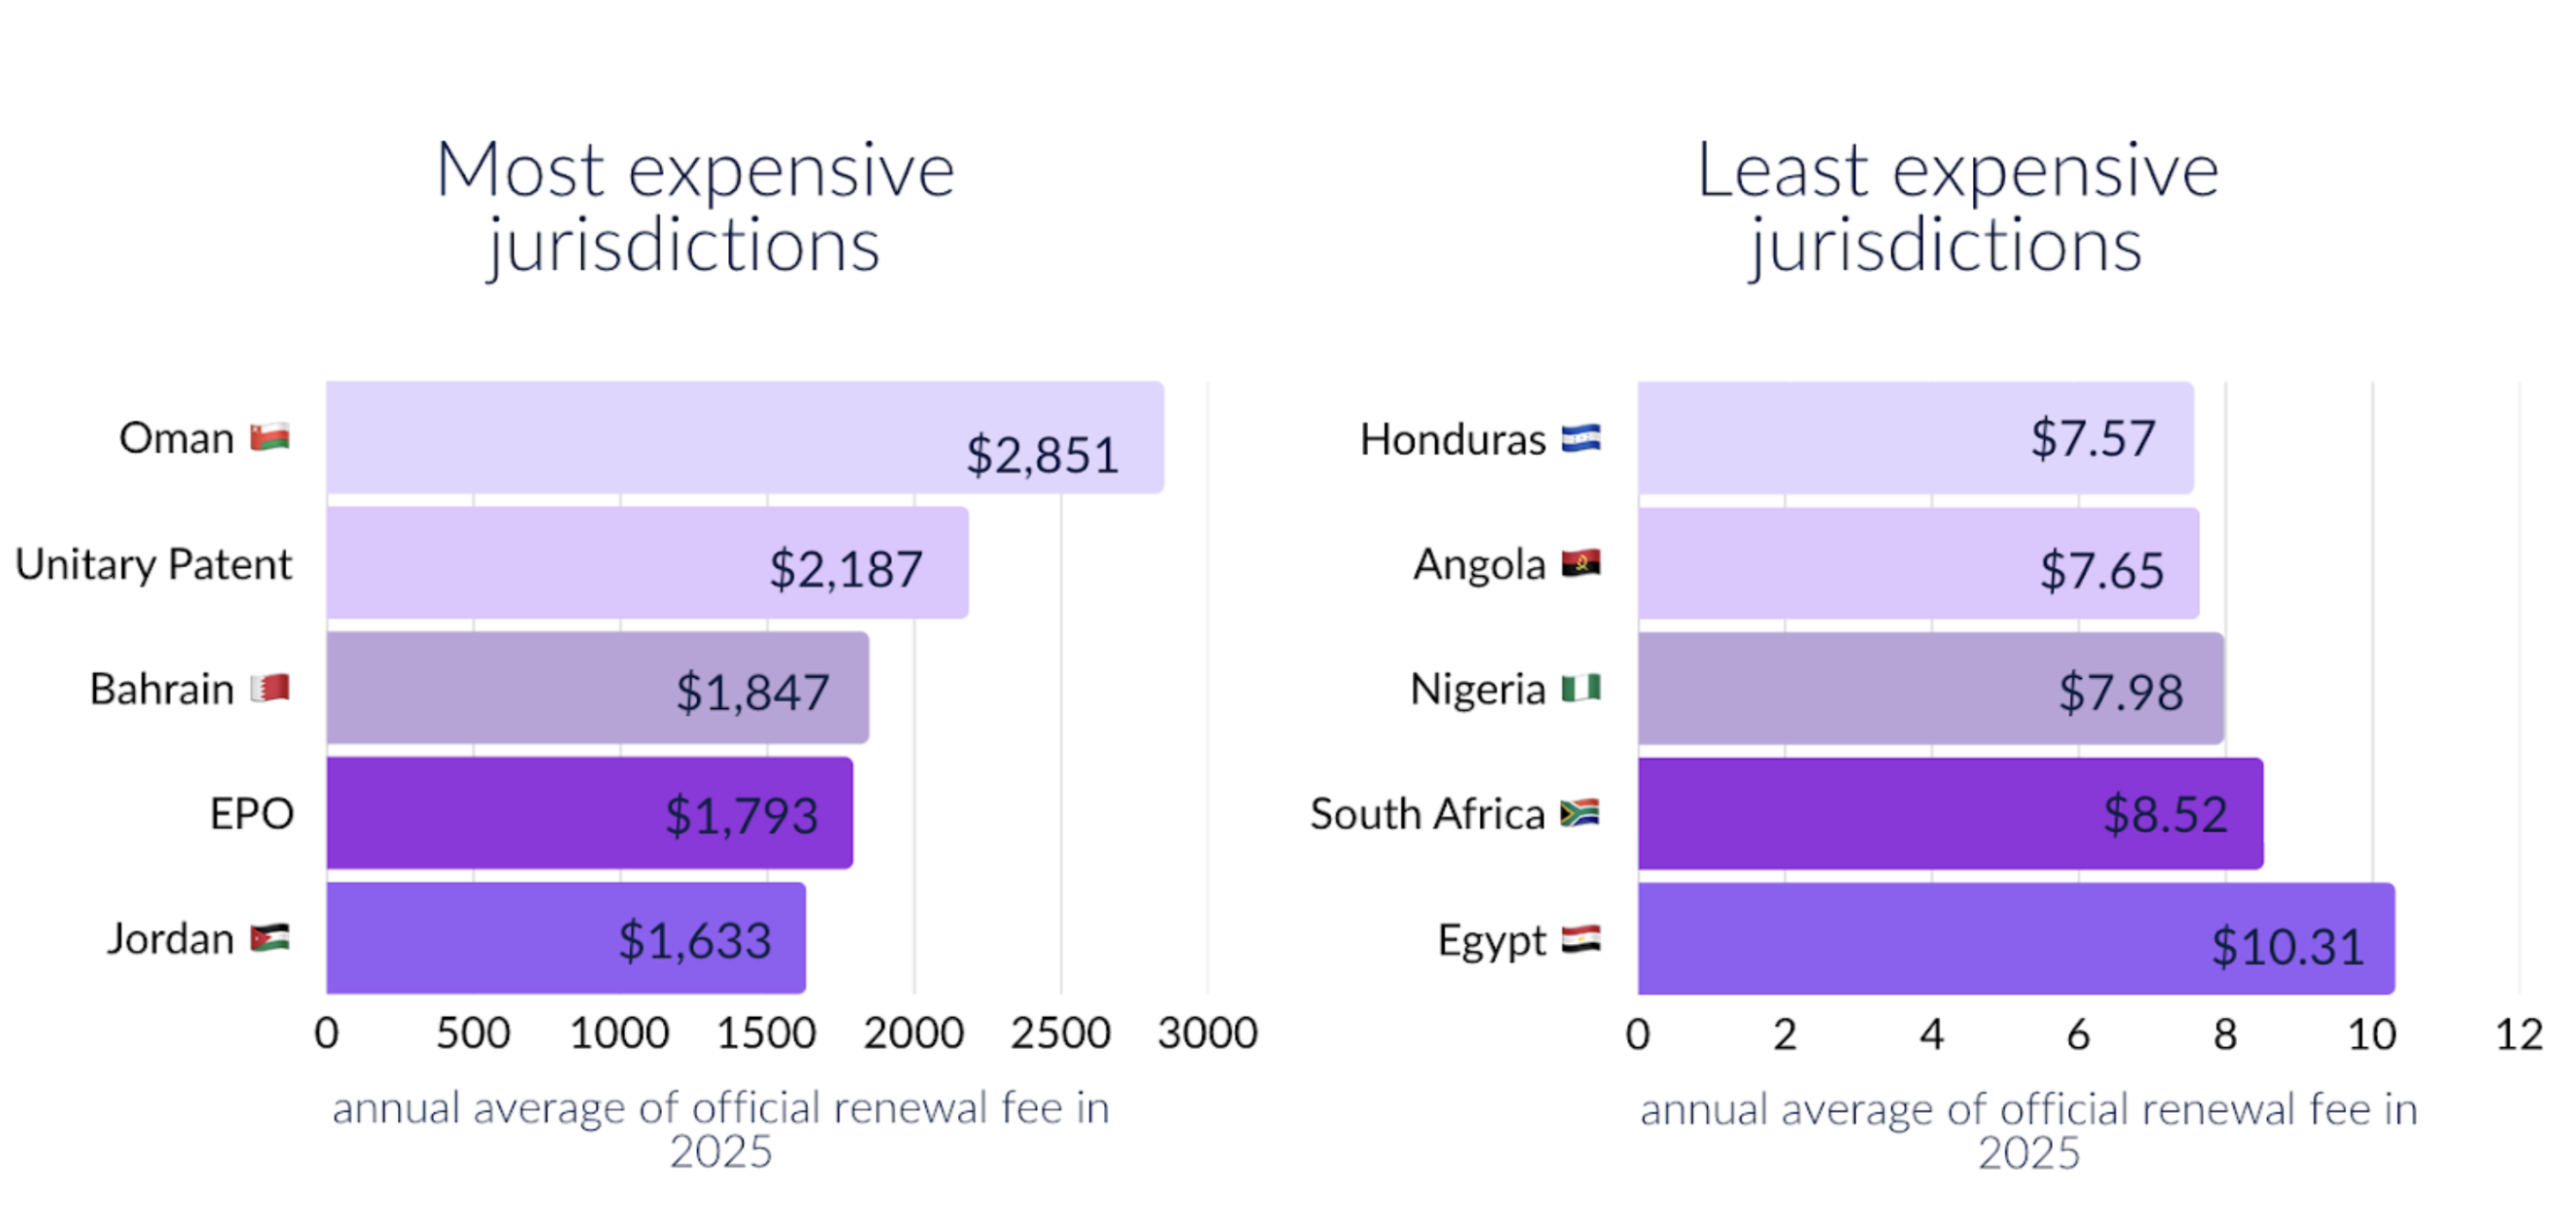
In 2025, the global average official patent renewal fee in our verified dataset was $517 per patent. However, this average conceals extreme variation. Some jurisdictions cost more than $2,000 per year, while others remain below $10.
For example, Oman averaged $2,851, while Honduras averaged $7.57. This difference is not marginal. Over a multi-year lifecycle, it fundamentally alters the cost profile of a portfolio.
What this means in practice is that the patent renewal strategy cannot be uniform. Portfolios with heavy exposure to high-fee jurisdictions face structurally higher financial risk. In these markets, continued patent renewal needs clear justification in terms of revenue, licensing potential, enforcement value, or strategic positioning.
In lower-fee jurisdictions, maintaining protection can make sense even with moderate commercial uncertainty, particularly when linked to manufacturing, supply chains, or long-term market presence.
Our advice is to allocate the budget deliberately. Forecast costs by jurisdiction, apply higher justification thresholds where fees are high, and use lower-cost markets to preserve strategic optionality where patents still matter.
Across portfolios, the largest source of avoidable cost comes from how renewals are executed. Based on our research and the renewal invoices we analysed we consistently see very limited transparency between official and non-official charges. This makes cost analysis and accountability difficult.
Here are the most common renewal setup issues we see that lead to unnecessary or inflated patent renewal costs:
Individually, these practices appear minor. Across large portfolios and long time horizons, they become a persistent source of budget leakage.
Late renewals represent one of the clearest indicators of operational health. Patent offices charge surcharges when someone pays a patent renewal after the normal due date. The exact rules vary by jurisdiction, but late renewals typically trigger an extra official charge during the grace period.
(Use our free Patent Grace Period & Surcharge Checker to find out if you are still in the grace period, and if not, to see exactly how much the surcharge is in your jurisdiction.)
In most cases, late payments come from delayed approvals, slow internal processes, banking hold-ups, or reliance on local agents, not from the underlying patent law itself. In our dataset, 95.2% of renewals were paid on time. The remaining 4.8 % generated average surcharge costs of $225 per late renewal. These penalties are almost entirely avoidable.
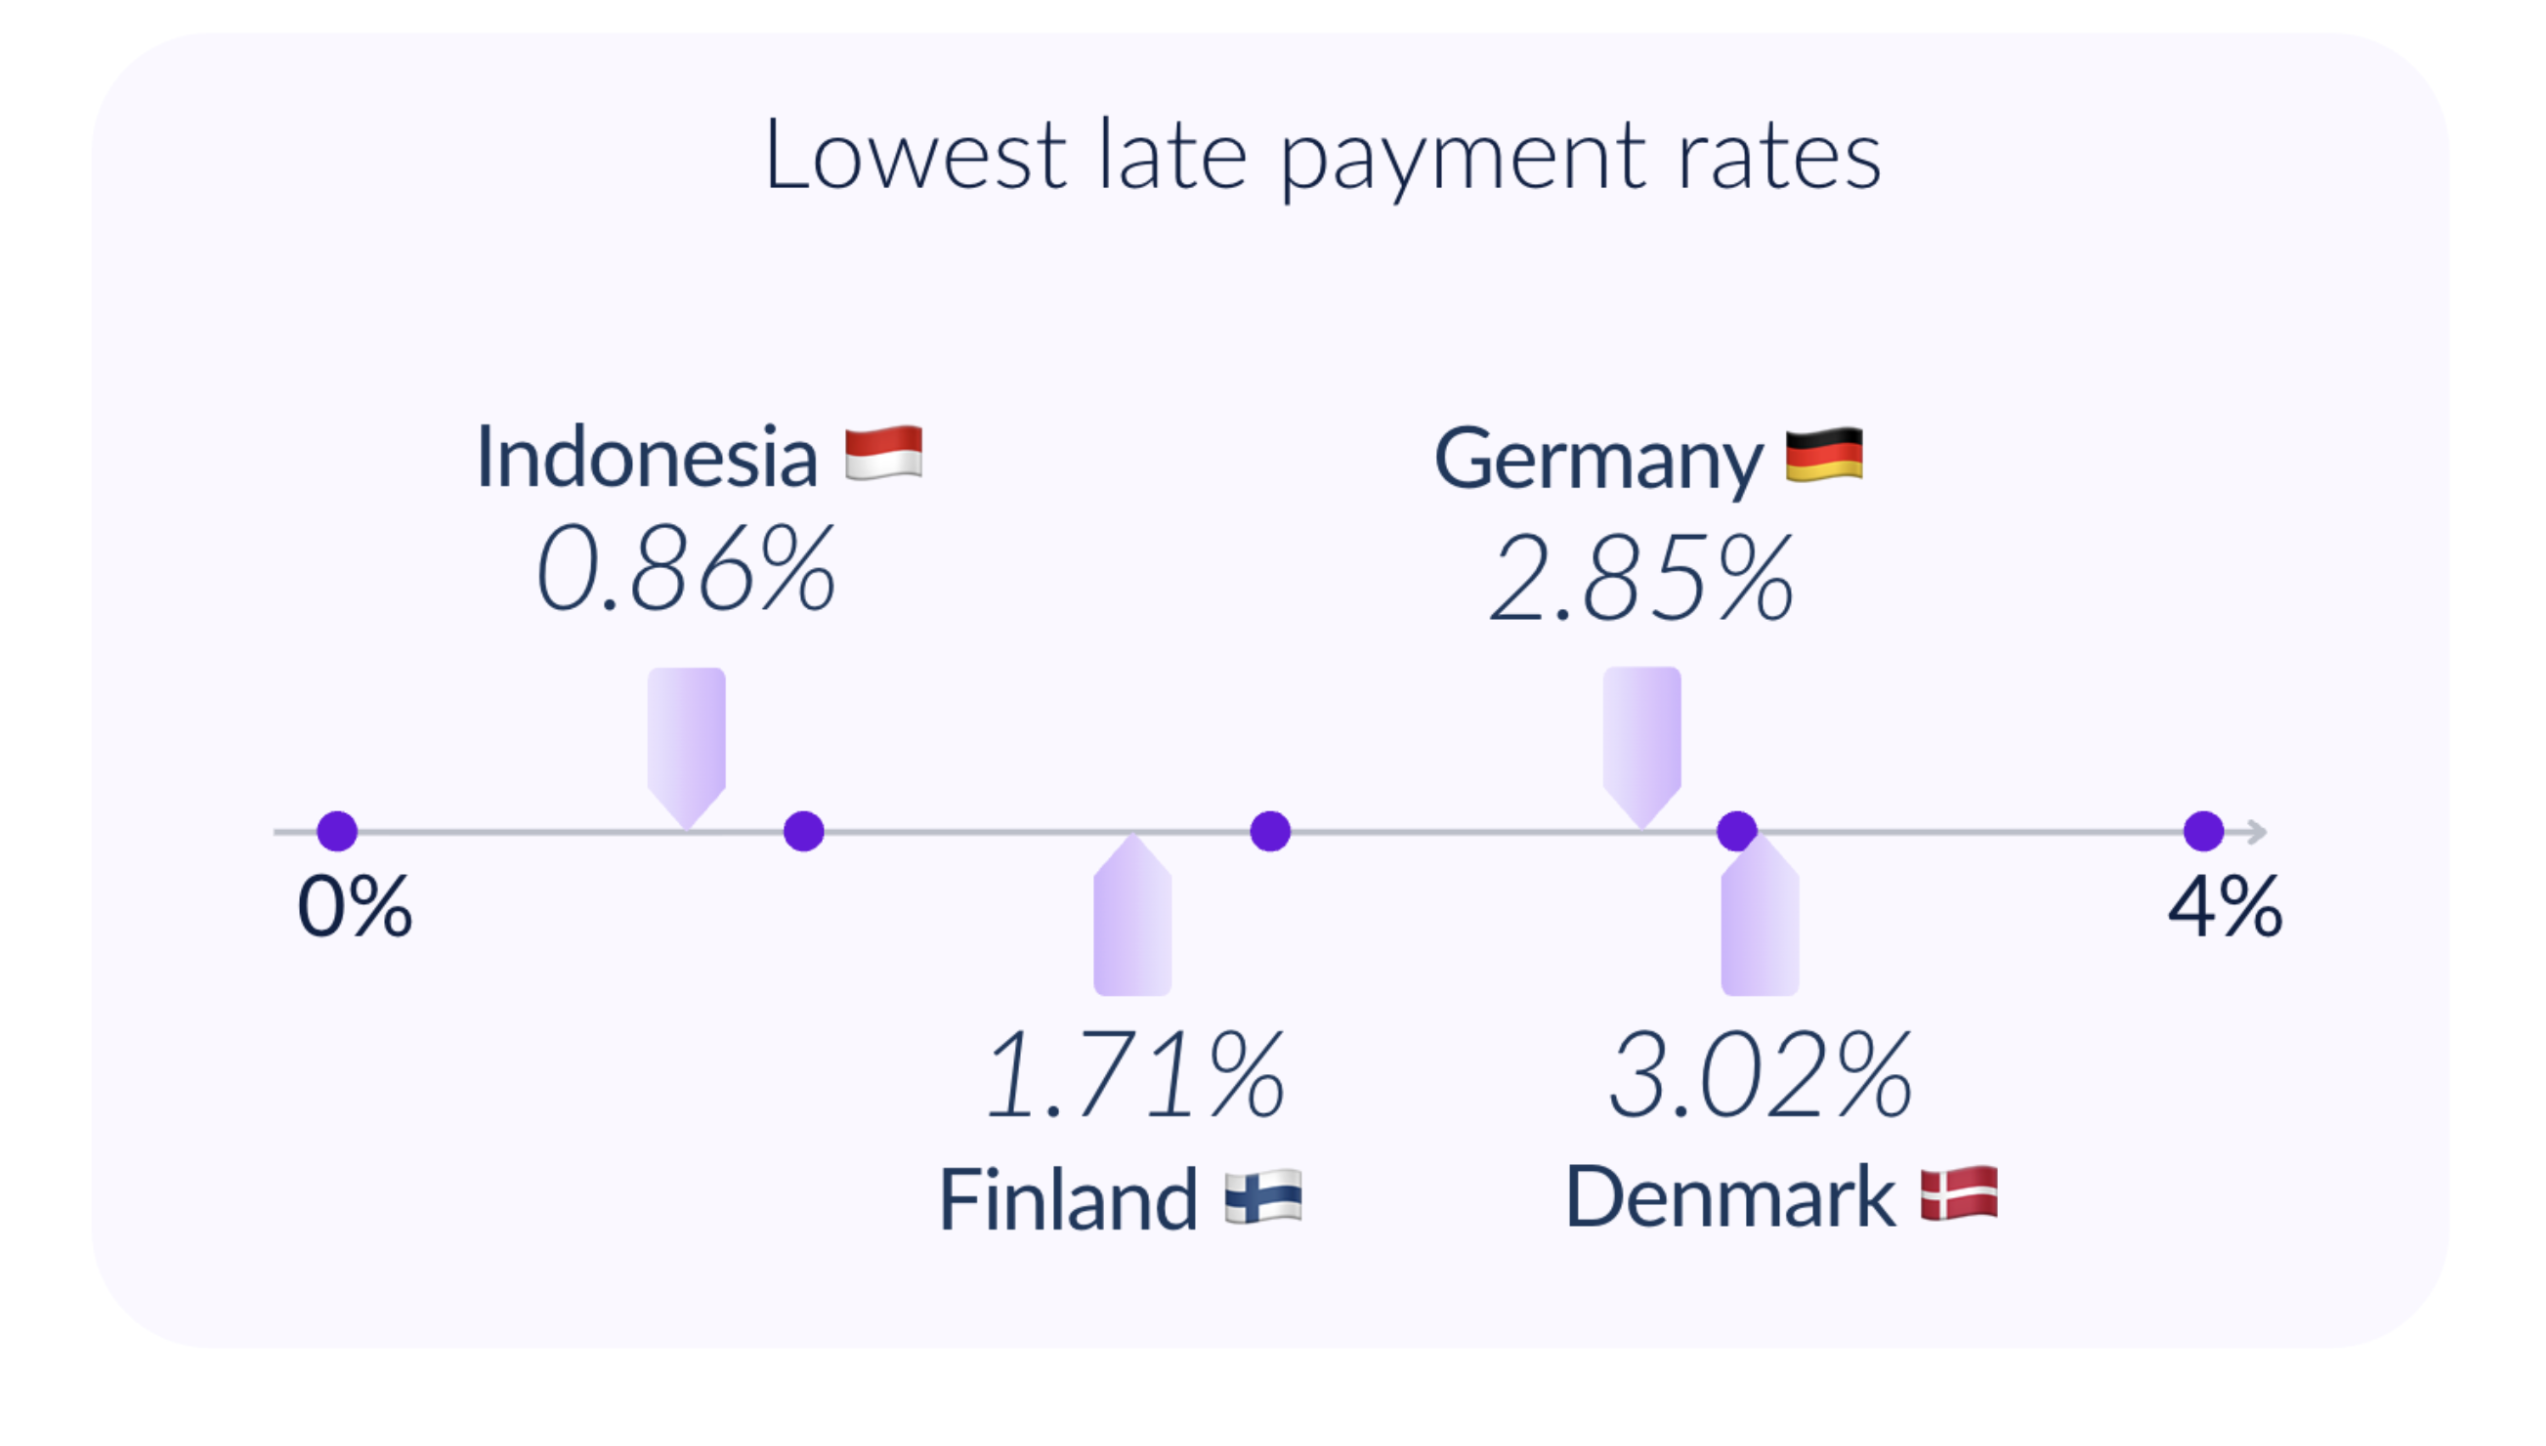
Country-level data highlights how widely late payment performance varies. As shown below, Indonesia records the lowest late payment rate at 0.86%, followed by Finland, Germany, and Denmark.
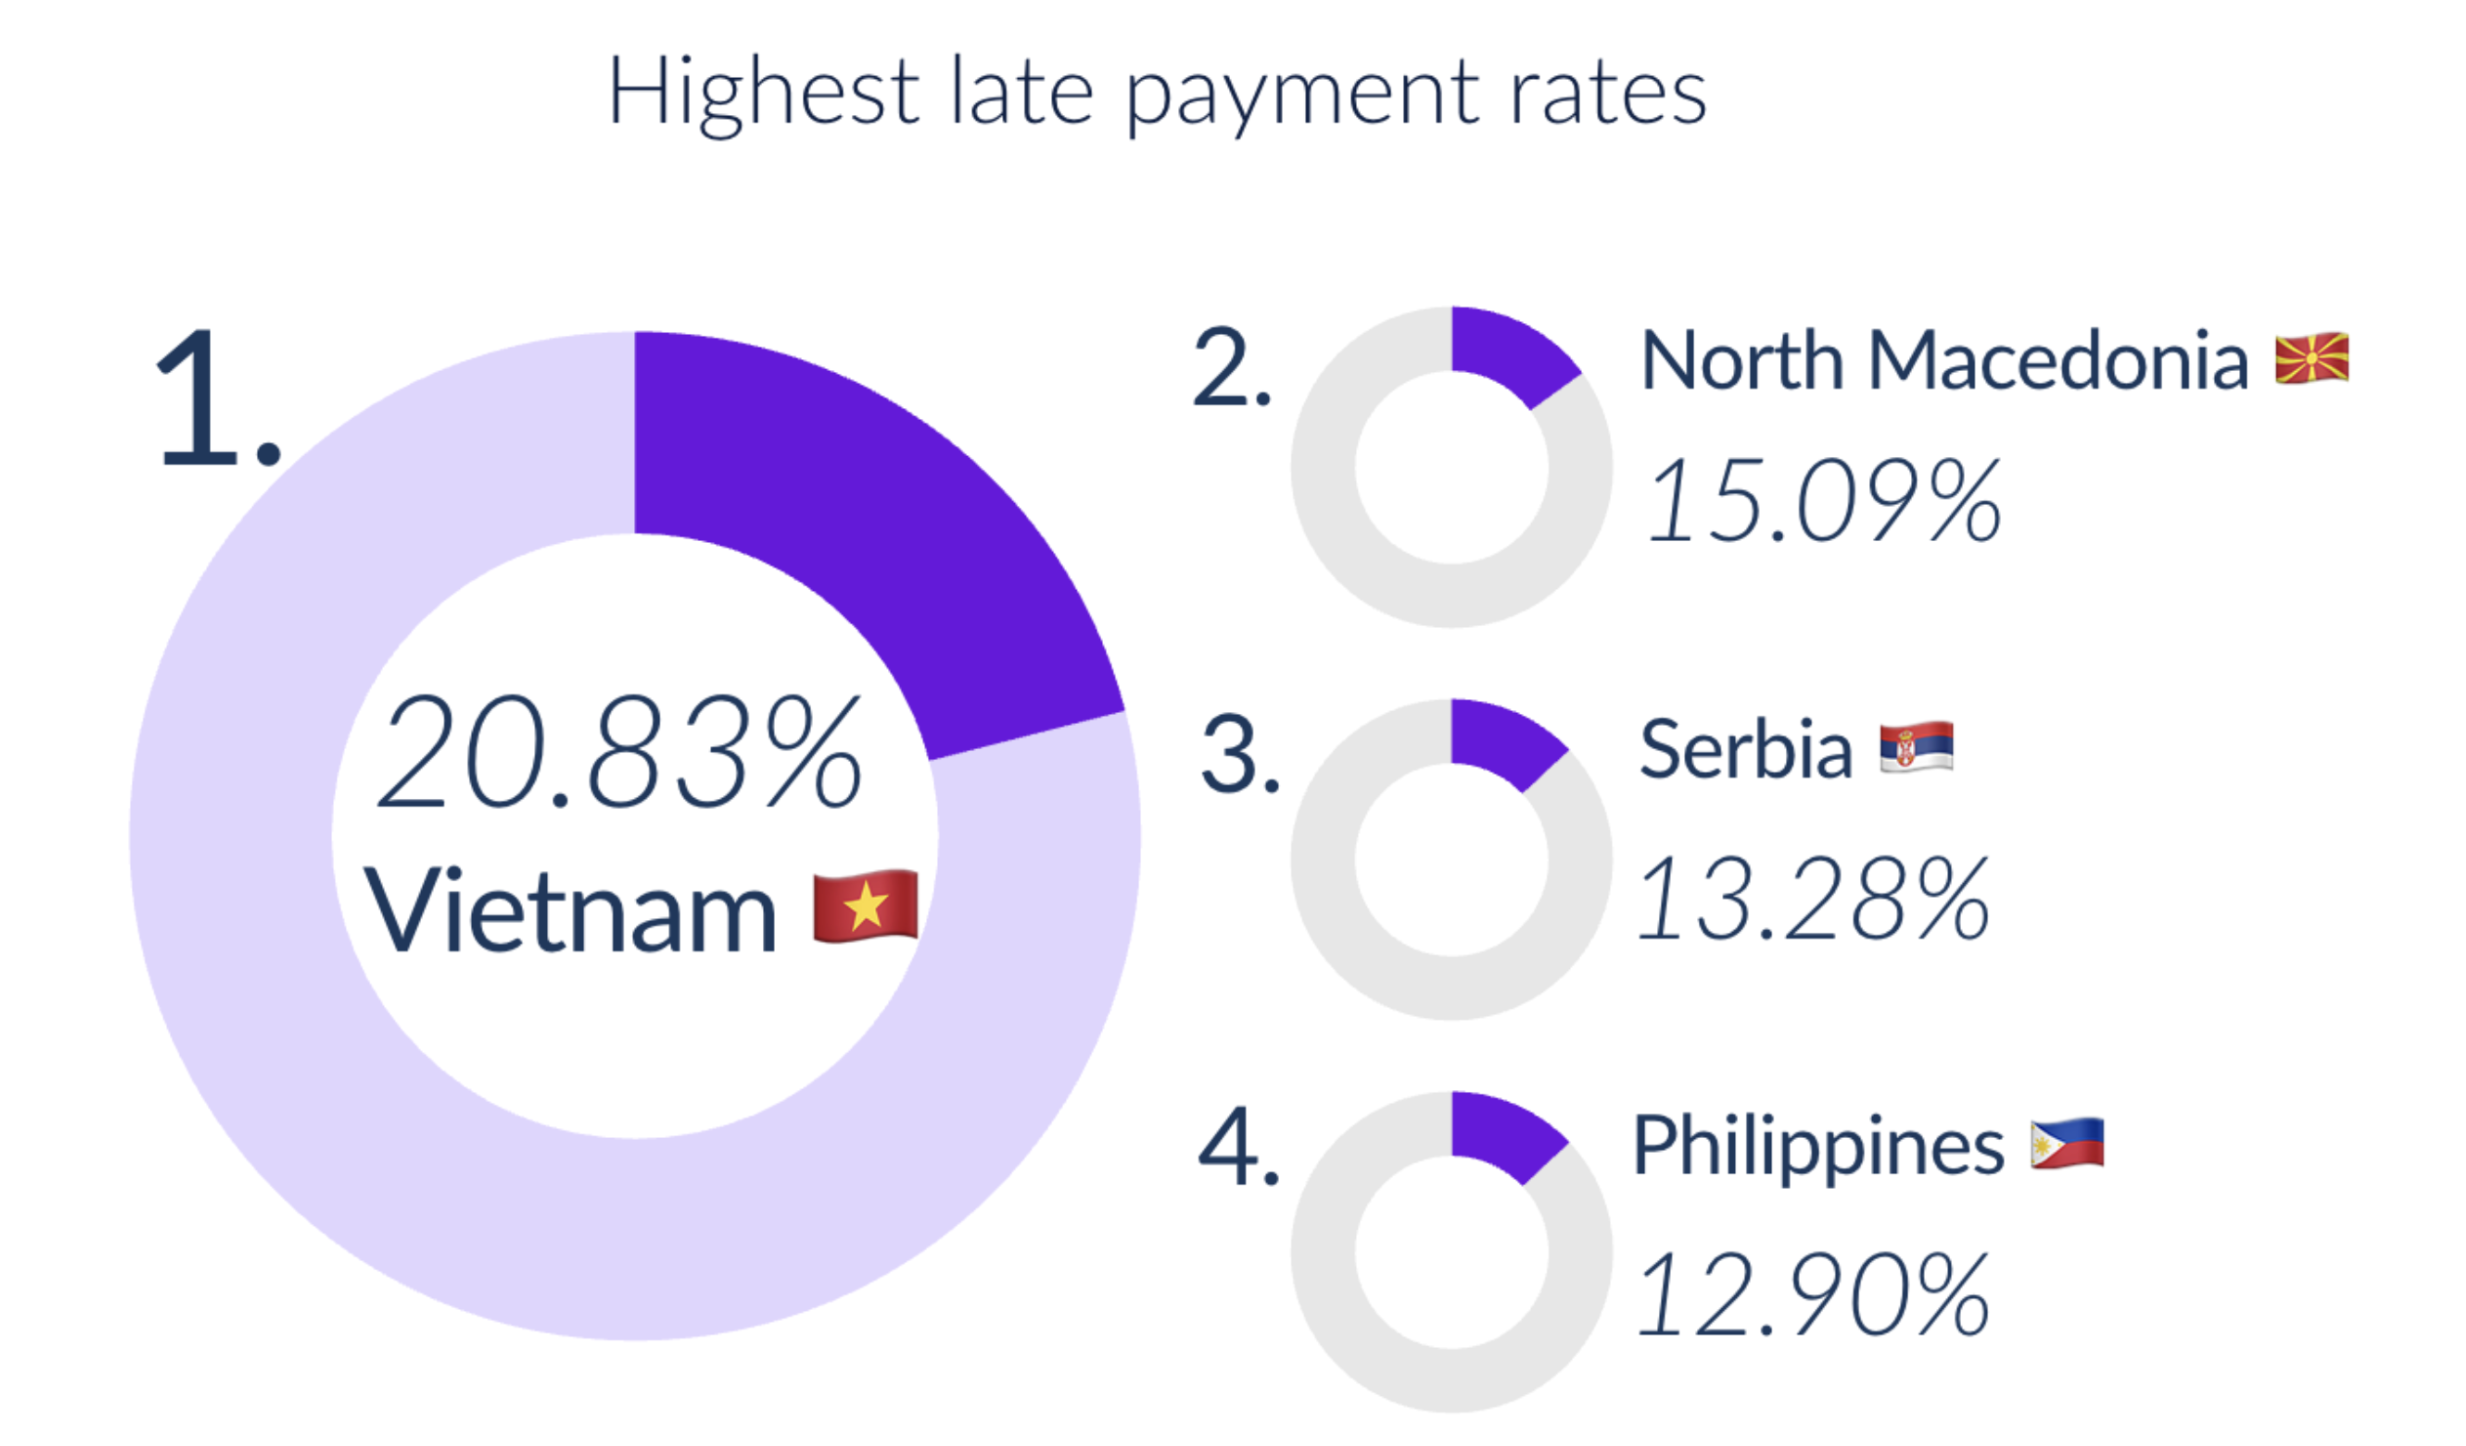
While Vietnam reached 20.83 %. In practical terms, this means that in some jurisdictions, one in five renewals enters a surcharge period.
These delays translate directly into financial penalties. In our dataset, we saw avoidable surcharges climb to over $715,000. This shows how quickly small, individual penalties can snowball when you’re managing large patent families across multiple borders.
For all the expert insights with extended data, download the full report here.
To make these patterns easier to interpret, we grouped portfolios into three operational health categories based on their late payment rates. This benchmark shows how renewal performance typically translates into financial risk, and where most organizations fall in practice:
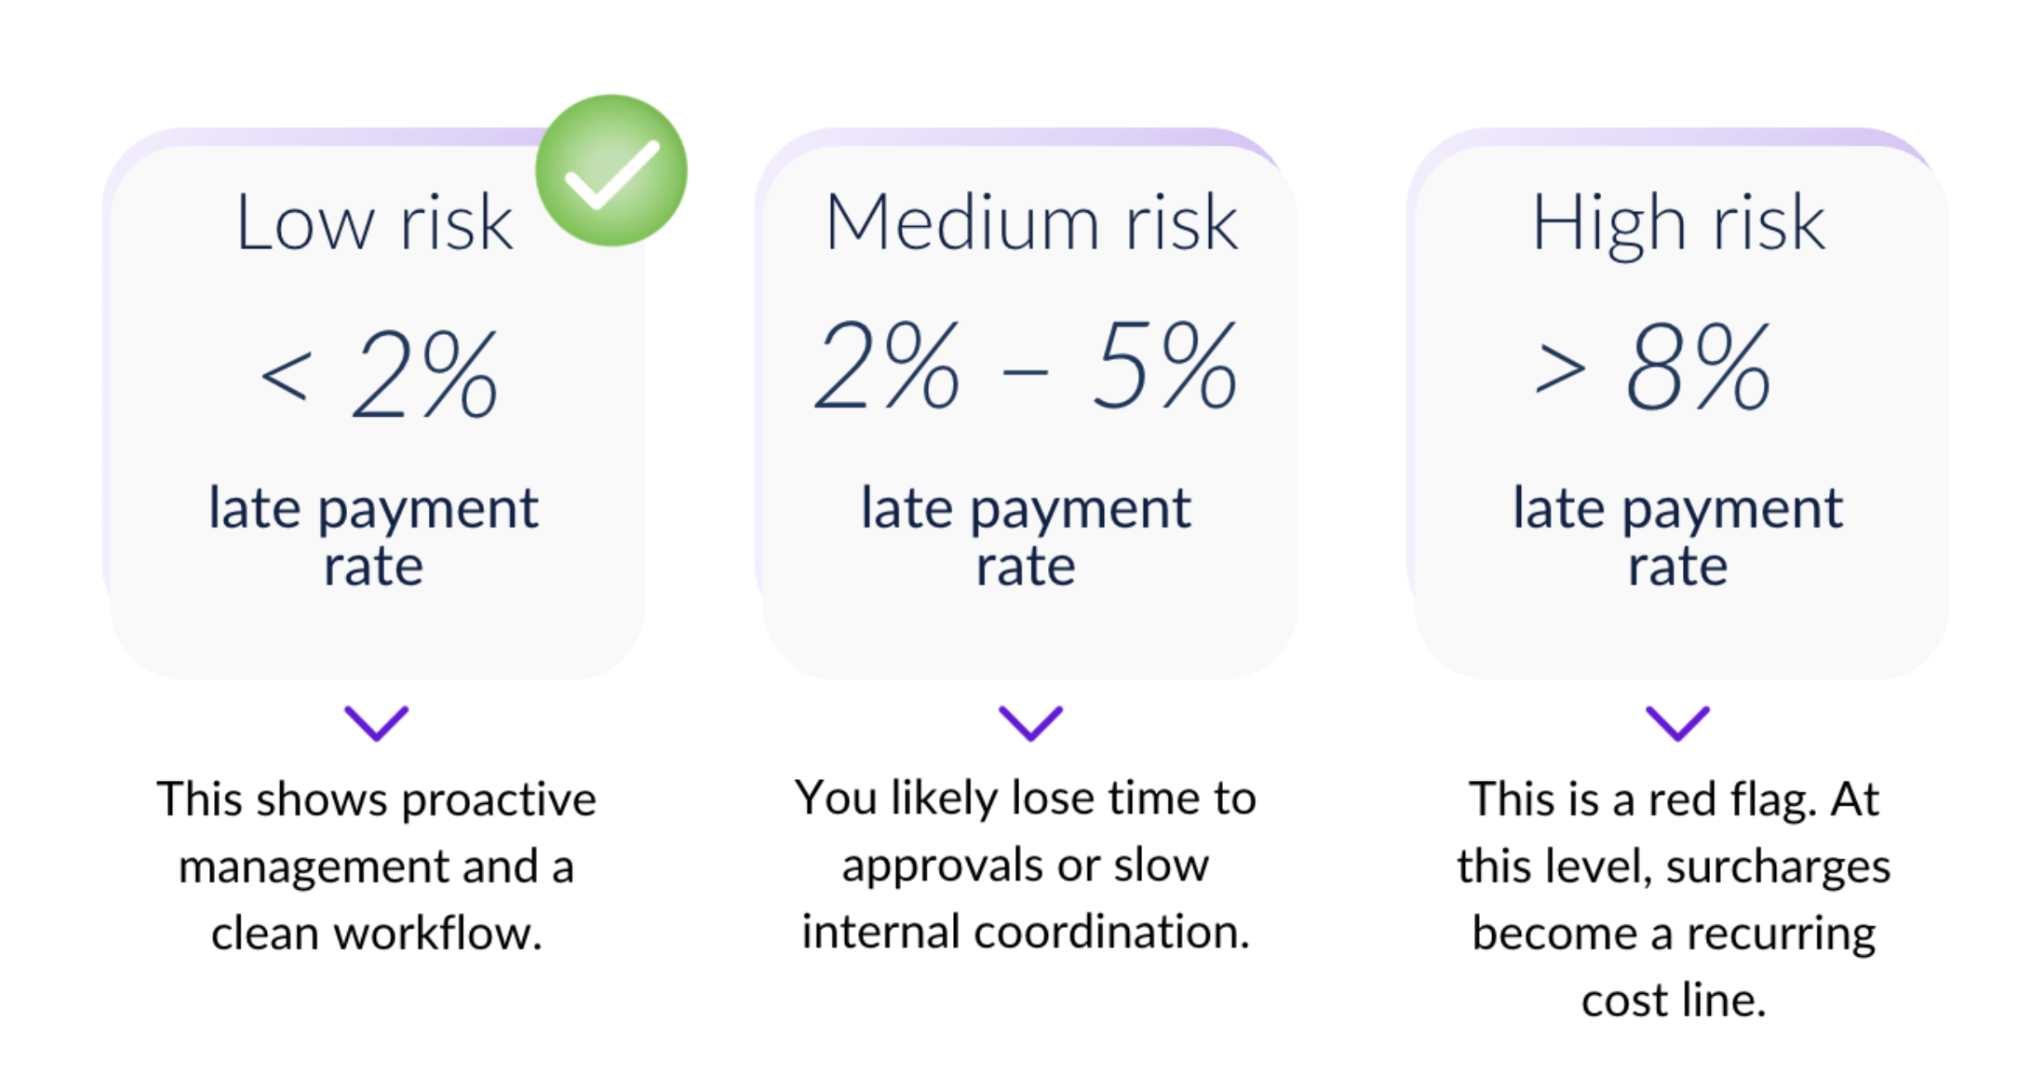
Portfolios with less than 2% late payments usually have strong controls and predictable costs. Rates between 2% and 5% often point to approval delays and coordination gaps. Above 8%, late renewals become a recurring issue and start driving avoidable surcharge costs.
Across the portfolios we analyzed, the same operational habits appeared again and again. Below, we highlight a few from the full report:.
When patent renewal is built around accurate data, clear responsibilities, and transparent cost structures, spending becomes predictable, decisions become easier to justify, and patent protection remains aligned with real business value.
With PatentRenewal.com’s free IP renewal cost audit you can easily benchmark if your fees are fair and optimal. Or you can sign up for a personalised live demo and see how an all-in-one IP renewal solution can save time, costs, and manual work in your patent renewal process.
For the full data, in-depth analysis, and complete benchmarks, you can access the 2025 Patent Lifecycle Report here.
Interested in a free IP renewal consultation? Benchmark your current IP renewal setup and costs against market standards.

.png)